Contents of this page:
Tracking progress
The race server doesn’t expressly monitor the activity of students — that’s not what it’s for — but it can help you spot some patterns of activity.
What activity is shown?
There are three or four things the race server records that can help you spot when a student is not participating or perhaps falling behind:
- Login activity
- Git repo forks (if enabled)
- Task texts (for the report)
- Buggy JSON uploads
Login activity
The admin dashboard summarises who’s logged in (to the race server) today, who’s logged in during the last seven days, and who has never logged in. This allows you to quickly see any students who have not accessed the race server while logged in.
We don’t track activity of site visitors who have not logged in — so browsing the tech notes and scrutinising the specs, which is a sound way for a student to be thinking about the project, does not get picked up.
If you’re running the project such that the buggy editor repo is automatically forked into the students’ GitHub accounts (IS_USING_GITHUB_API_TO_FORK is Yes) then logging in is a requirement to getting started.
Git repo forks
If you’re running the project such that the buggy editor repo is automatically forked into the students’ GitHub accounts (IS_USING_GITHUB_API_TO_FORK is Yes) then you can see which students have and have not got the buggy editor source code yet.
The other methods of distributing the source code do not require login to get started.
Task texts (for the report)
If you’ve specified that students should be submitting a report, the task texts give a helpful indication of progress. Students are encouraged — mainly by the timely convenience of the tool — to take notes on how they tackled each task as they are doing them. Towards the end of the project, they can download these task texts in the specific format needed to drop straight into their report.
It’s a good idea to try to can impress upon your students the usefulness of taking notes as they go along, which is what the task texts are doing. The two benefits to the students are:
-
Writing the notes at the time they are tackling the task means they can remember what they did to solve the problem. This is much harder to do retrospectively.
-
There’s a button for downloading the student’s task texts in the right format to drop into the report. It will even do the markdown to HTML conversion for them.
It’s human nature that some students will stubbornly refuse to recognise these benefits until it’s too late, but many do. As a result, we’ve found that the general progress indicated on the task text matrix is a helpful indicator of the group’s, and often individuals’, progress.
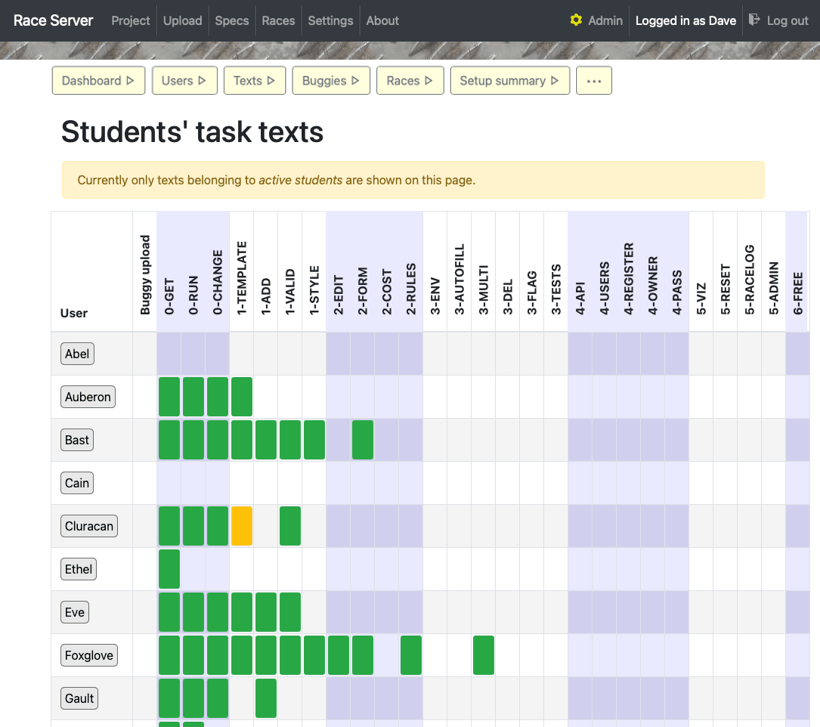
The task text “matrix” shows which tasks students have saved notes against — these can be downloaded to form their reports towards the end of the project. You can click on a cell to view the student’s text for the given task.
For more about monitoring this, see day-to-day running: viewing students’ texts.
Some students may prefer to take their notes offline, using other tools. That of course is fine, provided that is what they are doing.
Because we are not doing any assessment on the server, the task texts are not a mechanism for knowing the progress students are making… but they are a useful indicator.
Buggy JSON uploads
We don’t keep an audit trail of the buggy uploads. The database contains the last JSON that was uploaded (for each student), and the last buggy that was created as a result of such an upload. These don’t always coincide: if a student uploads bad JSON — that is, JSON that doesn’t parse — it will be saved as the upload, but the buggy won’t be updated.
The sophistication of the buggy can be an indicator of what their editor is capable of doing. The default buggy is fairly easy to spot. Early on in the project you expect to see buggies whose only changing characteristic is the number of wheels, because that’s the only input that is provided in the initial buggy editor app. Of course, the editor doesn’t need to be used to generate the JSON — but that’s part of the learning curve for the students.
Once you start running races and varying the cost threshold, a great indicator to look out for is which students change their buggies’ cost to be a point or two below the maximum cost for every race. This generally is the result of functioning 3-COST task: the student is using the editor they build to edit their buggy to a numerical criteria.
What activity is not visible on the server
Remember that the students are not doing their development on the server. So there’s no analysis or access here to the work they are doing: that is, the programming and problem-solving and debugging.